If you're a marketing leader, a CEO or CFO, or a board member, this article is meant to help you gain confidence in, and clarity around, your marketing investment - and ultimately accelerate your decision making and business growth.
Added bonus for startups: Quantifying the business impact of your marketing function can increase company valuation. Startups looking to exit will navigate due diligence and command a higher multiple when they can prove their go-to-market engine is sustainable (can be quantified beyond sales bookings alone) and scalable (primed to expand further with more cash infusion).
Show Me the Money
For marketing leaders, it's an age-old question - “what business value has our marketing investment actually produced?” Marketing is broad. It touches arguably every part of the business. Some organizations throw in the towel and simply chalk marketing up as a “cost center” and pick an investment amount that seems reasonable or aligns with an industry benchmark. Clearly, not a good approach. Other organizations measure marketing's impact too narrowly by aligning it solely to quarterly or annual revenue - the here and now. Better - but that's both too short-sighted and muddies the water with variables outside of the marketing function's control such as sales win rate or, in many cases, pricing strategy and thus average deal value.
So, how do you realistically measure marketing success in financial terms? As a marketing leader, answering this question will propel both the business and your career. Instead of being handed a budget, you'll determine the marketing budget. Instead of dispelling doubts about spend on individual campaigns and tactics, you'll let the numbers speak for themself.
Instinct or Analytics
In today's “data-driven” and “AI-powered” world, the promise of analytics for everything has led some organizations to ignore the reality that marketing is broad, complex and has a substantial “long view” component to it. Data-driven marketing has been a game-changer and is a must - don't get me wrong. However, sometimes the pendulum can swing too far. Marketing is both art and science, both instinct and analytics, both strategy and execution. With that said, it is critical to measure the right things, and measure them the right way.
Drowning in Data
Can you have too much of a good thing? I think so. Too much data presents two problems that become a barrier to successfully measuring marketing in financial terms.
- Data Architecture: There's no question we have a mountain of data. Without proper data definitions, architecture and integration you'll end up with a Tower of Babel that is unusable. All too common, what one system defines as a “Lead”, another considers an “Account” and another a “Prospect”. Right away, things get lost in translation without a shared language and proper architecture to map these definitions before any system integration occurs.
- Data Hygiene: The bane of many marketers' existence… bad data. Without process control and personal accountability across an organization, very quickly the best data architecture can be wrecked by inconsistent data entry by humans. So many people touch this data during its lifecycle… marketing campaign managers, sales reps, account managers, and customer support specialists to name a few. Without airtight data governance, training and routine data hygiene review, this too can destroy your ability to measure your investment.
It can be done. It should be done! I only mention this as it is a prerequisite to getting any further.
Agree on Terms
First and foremost, all stakeholders need to agree on a model by which to answer the question posed above - “what business value has our marketing investment actually produced?” This can be answered several ways with several models. Each is valid, but it's important that everyone understands them clearly and interprets them correctly.
Regardless of the model(s) you use, there are some basic variables you must pin down.
- Average Deal Value (ADV) goes by many different names, but it is simply the expected revenue from a new customer. Take the total revenue achieved in a given period (typically last fiscal year) and divide it by the number of won deals.
- Win Rate can be thought of as the batting average for the sales team. What percent of deals are they expected to win? Of course, you'll need to also define what constitutes an “at-bat” and what doesn't. That comes next. But it's worth noting that this rate is NOT simply Closed-Won divided by created Opportunities. Rather, it is Closed-Won divided by all "closed" opportunities.
- Funnel Stages and Conversion Rate for each can vary greatly from one organization to another. Define the stages and the rate of progression from one to the next. Let's use a simple example:
- Prospect: A named individual that matches your ICP (Ideal Customer Profile) that you can directly market to. For a B2B company, this individual must match the right titles, the right geography, and work at the right type of company.
- Lead: A prospect that has now sufficiently shown buying intent. That last bit (buying intent) can be defined as an aggregate of particularly interesting website activities, third-party buying intent data, and online inquiries. Whatever it is, it should be both an indicator of "in-market" and agreed upon by sales and marketing.
- Opportunity: A lead that has sufficiently engaged with sales - typically has had a 1:1 fruitful meeting that resulted in planned next steps. This is likely your “at-bat”.
- Pipeline: The aggregated expected revenue associated with qualified Opportunities. This may be a “Stage 1 Opportunity” if that is defined as an Opportunity that has legs and is being pursued.
- Lifetime Value (LTV): A customer is worth more than their initial purchase alone. Customer Lifetime Value factors in the average total revenue value of a customer across their lifecycle. The easiest example is in a subscription-based model, if the average customer sticks around for 3 years, the LTV is the ADV (see above) x 3.
With each, you'll have a conversion rate (i.e. Prospect to Lead, Lead to Opportunity, Opportunity to Win). It's quite common for the Funnel Stages to be more granular, particularly within the Opportunity object - such as Stage 0, Stage 1, and so on. But the rules are the same - be specific and be consistent.
Next, we're ready to dig into the marketing performance metrics you need to know to answer our elusive question - “what business value has our marketing investment actually produced?”
Marketing Performance Metrics
So far, we laid the foundation and defined the basic variable assumptions of the marketing funnel (aka sales funnel or buyer journey). Now, we're ready to talk about marketing performance metrics!
Marketing-Sourced Revenue: This is a given. It is certainly good to know how much revenue could be clearly attributed to marketing activities. But given the customer journey map frequently looks like spaghetti and might include 20+ digital touchpoints over a months-long sales cycle, one could ask realistically “Isn't practically all of our revenue marketing-driven?” And that's where you get into the debate of “sourced” vs. “influenced” and various attribution models.
The downside is two-fold: its short-sighted and introduces uncontrolled variables. Sourcing sales revenue for a given period is only part of the answer to our question, “what business value has our marketing investment actually produced?” And in business models that include a Sales team, marketing doesn't control closing the deal and so you've introduced a variable beyond the purview of marketing.
While imperfect, defining and measuring “Marketing-Sourced Revenue” is useful - and relatively simple.
Marketing-Sourced Pipeline: In the case of measuring Pipeline, we've back up a stage and eliminate the uncontrolled variable of a Sales Win Rate. Measuring pipeline revenue may be a more accurate and fair way to isolate and measure marketing performance. But it too should be noted does not tell the full “business value” story as marketing efforts plant seeds that will bear fruit in years to come.
Marketing-Sourced LTV: LTV addresses the short-term nature of measuring pipeline. It does, however, reintroduce the variable that every new customer must also be attributed to the effort of Sales too. But measuring LTV is extremely valuable to ensure your business does not think only short-term and sees the mid/long-term value of marketing investment.
These three metrics are great - but all related solely to revenue. So, now the question to ask is “has marketing been tasked to produce any other outcomes of value to the business?” Back to the beginning of this article, we established that marketing touches many parts of the business. Consider how valuable it is to the business to recruit top talent and how branding, PR, and social media may contribute. Consider how valuable it is to the business to be seen as an industry leader and how field marketing, analyst relations, and content marketing may contribute. We could list more intangibles - customer retention, acquisition interest as well.
Now we're getting to the crux of the problem. How do you measure these hard to measure contributions? Now is a good time to refer back to the "Instincts vs. Analytics" paragraph. We can and should get closer to quantifying marketing performance, but we shouldn't expect data to make our all our decisions for us. But by measuring Business Value by Outcomes", you can achieve, for all intents and purposes, a complete picture of marketing performance.
Business Value by Outcomes
Measuring revenue, pipeline, and LTV, while crucial, is incomplete. Another lens by which to measure to marketing performance is by outcomes - and assigning monetary value to these outcomes. What is the value of an Opportunity? A Lead? A Prospect? Even a website visitor or social media follower? At first blush, non-marketers may roll their eyes at the latter, but there's no debating these have some intrinsic value to the business. Our job is to quantify it.
Remember those variables - average deal value, funnel stages and conversion rates? These variables will help us quantify the business value of these outcomes Marketing has been tasked with achieving. Each outcome is a fraction of a new deal determined by the conversion rates.
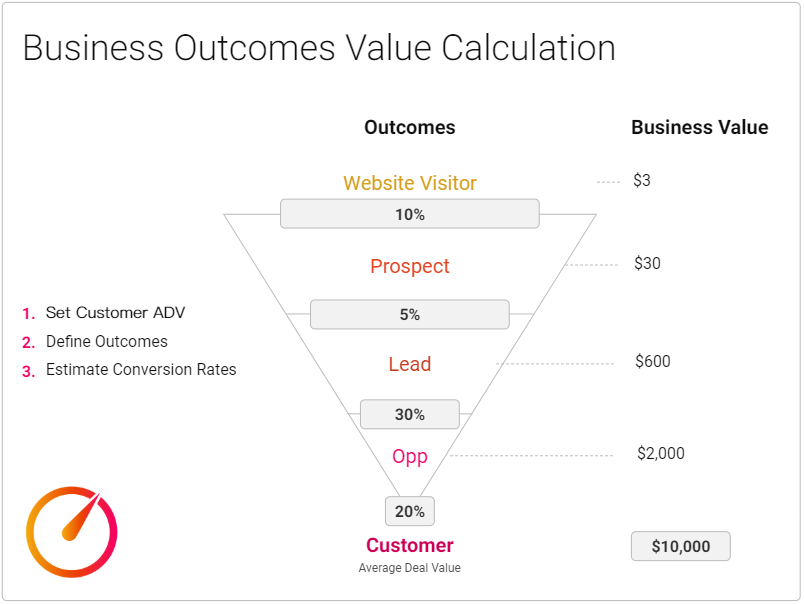
Example Business Outcomes and Value Calculation
- ADV = $10,000
- Opportunity Win Rate = 20%
- Lead Conversion Rate = 30%
- Prospect Conversion Rate = 5%
In the above scenario, the Business Value of each Outcome is:
- Opportunity = $2,000 ($10K x 20%)
- Lead = $600 ($2K x 30%)
- Prospect = $30 ($600 x 5%)
You can take this funnel further into typically tougher-to-quantify Outcomes as follows:
- If 10% of Website Visitors become Prospects (i.e. they match the ICP “and” share contact data that you can directly market to), then:
- Website Visitor = $3 ($600 x 10%)
Avoid Double-Counting
It's important to remember that we hope every Prospect becomes a Lead and becomes an Opportunity and becomes a Win. So, we have to be careful to not count the same individual toward every Outcome along their journey. This will incorrectly inflate the total. The total Business Value in this scenario would be calculated as:
((Prospect Count - Lead Count) * $30) + ((Lead Count - Opportunity Count) * $600) + ((Opportunity Count - Win Count) * $2,00) * (Customer Count * $10,000)
Essentially, winning one customer with the above conversion rates would result in: 5 Opportunities, 16 Leads, and 333 Prospects. Therefore, Business Value equals $34,110 instead of solely the immediate $10,000 in revenue, $50,000 in pipeline (5 Opportunities x ADV), or $30,000 in LTV ($10,000 x 3 years).
Business Outcome does not replace Revenue, Pipeline or LTV but complements them with a wider lens and weighted value by which to measure marketing performance.
Return on Marketing Investment
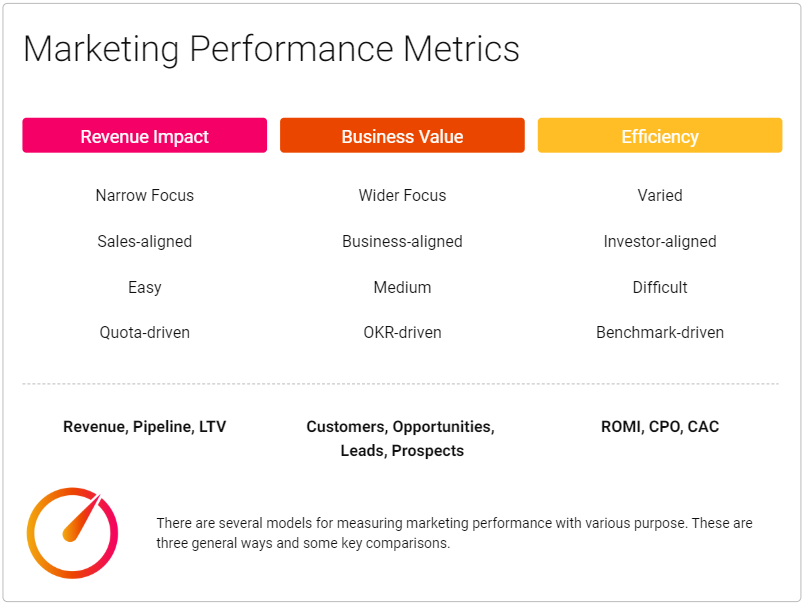
We've come a long way, but we're not done yet. We've measured revenue impact (narrow focus), business value (wider focus), but we haven't yet measured efficiency of our spend. Enter Return on Marketing Investment (ROMI), Cost per Outcome (CPO) and Customer Acquisition Cost (CAC).
- ROMI can be calculated a few different ways. It's important that you are clear and consistent with your formula.
- Return could be considered as profit, revenue, or pipeline.
- Marketing Investment could be considered variable spend-only or the all-in marketing investment including all staff and overhead.
- Whichever you choose, make it clear and make sure any comparable benchmarks are measured the same way.
- CPO is measured as the cost directly put into achieving an outcome. If the desired outcome of a campaign is Leads and the campaign generated 100 Leads while costing $10,000, our CPO is $100. Harkening back to our example above, we know a Lead is worth $600 to the business. Thus, we've achieved a 6X CPO.
- CAC is relevant to marketing but takes a comprehensive approach by including all sales and marketing investment. Take the entire amount invested in sales and marketing in a given period (typically last fiscal year) and divide it by the total number of customers won.
ROI Benchmarks
So, what's efficient? When measuring ROMI, CPO, or CAC, you must have a benchmark or target for it to have any meaning. This can be derived from industry research and/or your own historical performance. But in either case, be sure the formula is the same. With this data, set some benchmarks from the very beginning.
For starters, a CPO of 3-5x is considered good. A ROMI where R = Pipeline Generated and MI = Variable Spend, a 6-8x return is considered good. But these are only reference points. There's no shortcut to doing your homework and gathering the right data. Do your research and determine your benchmarks.
What's Next?
Now maybe you're just getting started and so you don't have the data to answer, “what business value has our marketing investment actually produced?” But, that's OK. What you need to do first is turn this question on around and ask the C-suite and the board “what business value do you expect marketing to produce?” Set the expectations! Because it starts with Objectives & Key Results (OKRs) and articulating what the company aims to achieve, and how marketing should contribute. Next, define your funnel and set some agreed upon variables. Now, you can define a logical and financially-sound budget to achieve these results. You're on your way to reporting your business value.
And now you know How to Quantify the Business Value of Marketing.